Start with the problem.
Tell us where reporting breaks, work repeats or decisions stall. We define a useful output before choosing tools.
From Raw Data.
To Real Decisions.
EVALUATION helps teams turn scattered spreadsheets, unreliable reports and manual processes into trustworthy data, useful dashboards and practical digital systems. Discuss a solution with our specialists, or explore the EVA software demonstrations.
Professional Services / Built Around Your Business
WHAT WE DOWhether your team needs a reliable KPI dashboard, an automated reporting flow or a tested AI prototype, we start with the problem, define the deliverable and build around your existing workflow.
KPI design, Looker Studio and management dashboards that make performance easier to understand.
Typical outputs: KPI dashboards, reporting packs and data reviews.Structured data pipelines, BigQuery, data integration and reliable reporting foundations.
Typical outputs: data pipelines, reporting datasets and QA checks.Google Sheets, Apps Script, APIs and workflows that reduce repetitive work.
Typical outputs: scheduled reports, connected spreadsheets and automations.Assess useful AI opportunities, develop prototypes and evaluate model performance.
Typical outputs: feasibility studies, prototypes and model evaluations.Business websites, internal tools and customer-facing digital experiences.
Typical outputs: websites, internal portals and custom interfaces.Brand systems, presentation design and visual communication for clear positioning.
Typical outputs: visual identities, pitch decks and digital assets.Professional services are scoped individually with agreed deliverables. EVA Workspace and EVA DataLab are separate, free public demonstrations — not paid client accounts.
Talk through a project ↗Why Work With EVALUATION
BUILT AROUND YOUR OUTCOMEYou do not need a technical specification to begin. Bring the business question; we help identify what data, systems and deliverables will actually solve it.
Tell us where reporting breaks, work repeats or decisions stall. We define a useful output before choosing tools.
Explore the portfolios of our five specialists and discuss the mix of data, cloud, AI or design skills your project needs.
Public EVA examples use clearly labeled sample data. Client engagements are scoped separately, with expectations agreed before work begins.
DescribeThe business challenge and existing tools.
DefineScope, deliverables, costs and timeline.
BuildReview progress and validate outputs.
Hand overDocument, explain and plan next steps.
Tell us the problem in plain language. We can help decide whether you need a dashboard, automation, cloud data work or something else.
Discuss Your Project ↗The Evaluation Framework
01 / 05Every project moves through the same logic: understand what is happening, identify why it matters, and turn evidence into an improvement.
Understand the current situation through evidence.
Transform information into meaningful insight.
Turn understanding into a practical next action.
A Complete Intelligence Ecosystem
02 / 05Five EVA disciplines describe how we approach a client brief. Select a node to see the types of capabilities and project deliverables we can scope together.
Pillar 01 / Intelligence Foundation
Data Into Intelligence
EVA / PUBLIC SOFTWARE DEMONSTRATIONS
03 / 05This is how we approach client work: understand the source, make data trustworthy, then build useful reporting or digital tools. The public EVA demonstrations show parts of this process using sample or local files.
Spreadsheets, exports, APIs, CRM/POS data, JSON or existing databases.
Validate, standardise, structure, calculate KPIs and create reliable reporting data.
Find patterns, generate insights, forecast, test ideas and build the required logic.
Dashboard, automated report, management insight, prototype or digital workflow.
The Intelligence Unit
04 / 05Five disciplines, five individual portfolio pages. Choose the specialist whose work you want to explore.
Meet the whole team ↗DISCIPLINE 01
Python Developer · Data Science · BI
Builds Python web tools, automation, data workflows and executive dashboards — connecting raw information to software people can actually use.
DISCIPLINE 02
AI & Educational Technology Master Graduate
Builds practical AI and educational technology solutions across machine learning, data analytics, web development, robotics and accessible STEM prototyping.

DISCIPLINE 03
AWS · Cloud & Data Science Professional
AWS-certified cloud and data science specialist building automated architectures, serverless systems, predictive models and clear stakeholder dashboards with cost-efficiency and scale in mind.
DISCIPLINE 04
Graphic Designer · Minimalist Branding & Marketing
Builds calm, premium visual identities using Japanese-inspired restraint, typography and purposeful space — then carries the brand consistently across marketing, print, digital and packaging.
DISCIPLINE 05
End-to-End Data Automation · BigQuery / APIs / Dashboards
Builds the full data path from raw sources through cleaning, automation, warehousing and QA to decision-ready dashboards.
Selected Work & Public Demonstrations
EXPLORE THE EVIDENCEExplore work described in our specialists’ portfolios alongside the hands-on EVA example below. Portfolio descriptions are not independent proof of client outcomes, and demo figures are not real operating results.
Explore a cloud-cost monitoring and alerts project described in Muriam’s published portfolio.
Read portfolio ↗See Jamshed’s selected BigQuery, API automation and reporting workflows.
Read portfolio ↗Try an illustrative hospitality dashboard with synthetic transactions, sample metrics and decision prompts.
Explore demo ↓Verified outcomes and client testimonials will be published only with permission and supporting evidence. No sample result is presented as a real client achievement.
Featured Demonstration / KISSA COFFEE HOUSE
05 / 05Kissa Komorebi is built around a quiet idea: “A quiet cup, a gentle moment.” EVA turns that same brand and operating context into a privacy-safe management demo — from raw sample transactions to a decision-ready dashboard.
SAMPLE DATA ONLY. Brand information and visual assets come from the supplied Kissa materials. Revenue, customers, inventory and forecast figures are synthetic and are not presented as real client performance.

Sunlight filtering gently through leaves — translated into warm, quiet, everyday pauses.

The synthetic scenario flags peak service time and ingredient coverage as the immediate constraints. Growth only helps if the brand experience stays calm.
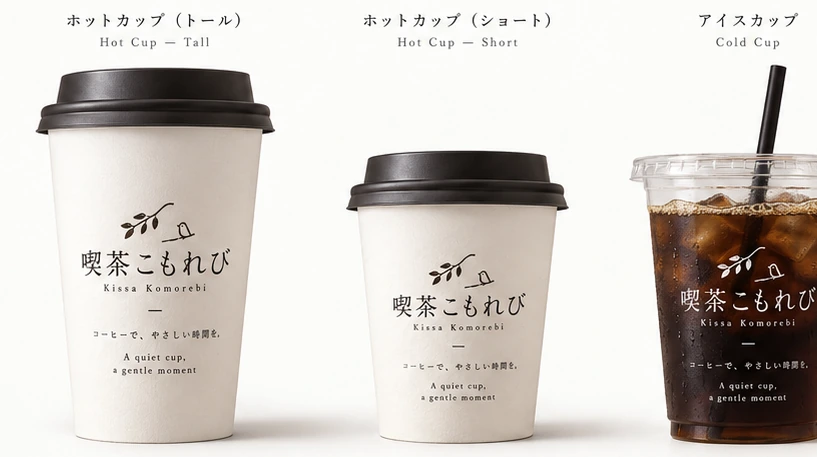
EVA keeps the brand promise visible beside the numbers, so operational recommendations do not optimise away the customer experience.
Coffee, food, bean and merchandise products use the supplied Kissa menu and brand system as context. The transaction records themselves are generated sample data.
The demo shows how the system behaves without exposing private customer, sales, staff or operational records.
Check staffing, prep and ingredient coverage before adding traffic to the busiest windows.
Test a coffee + seasonal bake offer that keeps the experience simple and consistent.
Surface take-home items after purchase rather than making the counter experience more complex.
The supplied Kissa brand story, visual system, menu and merchandise context. All analytical outcomes are explicitly modeled for demonstration.
FAQ's
COMMON QUESTIONSWe offer scoped professional services as well as public EVA demonstrations. Here are a few useful distinctions before you get in touch.
Read all frequently asked questions ↗EVA Workspace is the guided business demonstration built around the synthetic Kissa sample. EVA DataLab is the small-data interactive demo where a visitor can try a CSV and inspect cleaning, analysis, model evaluation and a decision brief.
No. The supplied Kissa brand story, menu and visual materials are real project assets; the sales, customers, stock, forecasts and recommendations are explicitly synthetic demonstration data.
No. The starting point is the business question. EVA is designed to help structure the data, surface useful evidence and choose an appropriate output instead of asking the client to specify charts first.
Yes. The AI + Human layer is for clients who want the signal translated into a management, marketing, pricing, operations or growth brief with a specialist involved.
Tell us what you want to understand, automate or build. We can discuss scope and deliverables with you, whether you have a full brief or only a starting question.
Discuss your project ↗